![]()
Townsville
City Council
Accelerated Sustainability Planning
 |
|
LEVEL 1: INDICATORS Objectives:
INTRODUCTION Indicators are representations of trends. Usually, they are presented in the form of measurements: how many, how much, how fast, how often, and so forth. Indicators are a way of looking at a complex system, assessing its current status, and signaling that status in simple terms. Sustainability indicators are about assessing sustainability -- the status of the complex systems that make up an entire human society, community, or organisation, together with the natural systems on which they depend. In this module, you will get an introduction to sustainability indicators, and some practice in thinking about them. You will also get some practice in using them -- to find linkages between different elements of the systems in which you play a part. In addition to the presentation slides, we've included a brief article for background purposes to read at your leisure. The indicators were also evaluated on the following criteria:
For more information on indicators of sustainability, and links to other
resources, go to the www.AtKisson.com
website. |
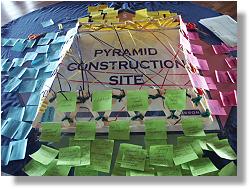
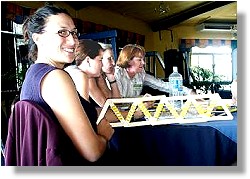 Representative of the Society Group demonstrates the structure of the indicator level of the Sustainability Pyramid. |
|
|
Sustainability Indicators
from Pyramid |
|||
|
|
Economy |
Society |
Wellbeing |
Nature |
1 |
Resource Efficiency |
Health Life Expectancy
|
Quality of School |
Marine Environment
Water Temperature |
2 |
Material (Self)
Efficiency |
Volunteers as
Proportion of Population |
Job Opportunities |
Number of Species -
Biodiversity |
3 |
Registered Patents
and Scientific Papers |
Social Isolation |
Personal Safety |
Percentage Parkland (Open Space) |
4 |
Creative Class(Worker
Knowledge Intensity) |
Social Cohesion |
Climate |
Percentage Natural
Environment |
5 |
Retained Workforce |
Wealth |
Quality of Shopping |
Per Capita Usage of
Water |
6 |
Value Added Industry |
Employment Income
in Relationship to Society |
Job Diversity |
Particulates in the
Atmosphere (Air) |
7 |
Under and Unemployment (% Human Capital Underutilisation) |
Educated Society
(tertiary, TAFE & trades) |
Travel Time |
Kilowatt Hours per Population (Energy) |
8 |
Job Creation |
Number of People Adopting
Sustainable Practices |
Sense of Community |
Waste to Landfill
Kilograms per Capita |
9 |
Local Gross Product |
Participation in Cultural
and Sporting Events |
Proximity |
Number of People Taking
Action |
Note: Ranking of Indicators does not imply priority or relative importance
|
|
| LINKING THE INDICATORS
A Linkage is a cause/effect relationship between two indicators. Actually, the link is between the systems that the indicators measure -- but the indicators are our windows into the systems. A Linkage can be parallel or inverse, direct or indirect. It's not necessary to master these concepts for the purposes of this workshop … but an understanding of them will help you in your search for linkages. Types of Linkage Parallel Linkage: When one indicator goes up or down, the other moves in the same direction. Inverse Linkage: When one indicator goes up, the other goes down (or vice versa, or both). Direct Linkage: The system being measured by one indicator directly influences the system being measured by another indicator. Indirect Linkage: The system being measured by one indicator is influenced by another system, which in turn influences the system being measured by a second indicator. There can be multiple chains of indirect linkage. |
|
|||
| Code |
Indicator |
Compass |
Linkages |
| E1 |
Resource
Efficiency |
Wellbeing |
|
| Society |
|
||
| Nature |
|
||
| E2 |
Material
(Self) Efficiency (comparison between gross regional product and gross regional imports) |
Wellbeing |
|
| Society |
|
||
| Nature |
|
||
| E3 |
Registered
Patents and Scientific Papers (Can relate to positive aspects such as enhanced Tropical Design and management of the environment.) |
Wellbeing
|
|
| Society |
|
||
| Nature |
|
||
| E4 |
Creative
Class (Worker Knowledge Intensity) |
Wellbeing |
|
| Society |
|
||
| Nature |
|
||
| E5 |
Retained
Workforce |
Wellbeing |
|
| Society |
|
||
| Nature |
|
||
| E6 |
Value Added
Industry |
Wellbeing |
|
| Society |
|
||
| Nature |
|
||
| E7 |
Under
and Unemployment (% Human Capital Underutilisation) |
Wellbeing |
|
| Society |
|
||
| Nature |
|
||
| E8 |
Job
Creation |
Wellbeing |
|
| Society |
|
||
| Nature |
Note:
job creation can be positive for environment. |
||
| E9 |
Local Gross
Product |
Wellbeing |
|
| Society |
|
||
| Nature |
|
||
|
|||
| Code |
Indicator |
Compass |
Linkages |
| S1 |
Health
Life Expectancy |
Wellbeing |
|
| Economy |
|
||
| Nature |
|
||
| S2 |
Volunteers
as Proportion of Population |
Wellbeing |
|
| Economy |
|
||
| Nature |
--- |
||
| S3 |
Social
Isolation |
Wellbeing |
|
| Economy |
|
||
| Nature |
|
||
| S4 |
Social
Cohesion |
Wellbeing |
|
| Economy |
|
||
| Nature |
|
||
| S5 |
Wealth |
Wellbeing |
|
| Economy |
|
||
| Nature |
|
||
| S6 |
Employment
Income in Relationship to Society |
Wellbeing |
|
| Economy |
|
||
| Nature |
|
||
| S7 |
Educated
Society |
Wellbeing |
|
| Economy |
|
||
| Nature |
|
||
| S8 |
Number
of People Adopting Sustainable Practices |
Wellbeing |
|
| Economy |
|
||
| Nature |
|
||
| S9 |
Participation
in Cultural and Sporting Events |
Wellbeing |
|
| Economy |
|
||
| Nature |
|
||
|
|||
| Code |
Indicator |
Compass |
Linkages |
| W1 |
Quality
of School |
Nature |
|
| Economy |
|
||
| Society |
|
||
| W2 |
Job Opportunities |
Nature |
|
| Economy |
|
||
| Society |
|
||
| W3 |
Personal
Safety |
Nature |
|
| Economy |
|
||
| Society |
|
||
| W4 |
Climate
|
Nature |
|
| Economy |
|
||
| Society |
|
||
W5 |
Quality
of Shopping |
Nature |
|
| Economy |
|
||
| Society |
|
||
| W6 |
Job Diversity |
Nature |
|
| Economy |
|
||
| Society |
|
||
| W7 |
Travel
Time |
Nature |
|
| Economy |
|
||
| Society |
|
||
| W8 |
Sense of
Community |
Nature |
|
| Economy |
|
||
| Society |
|
||
| W9 |
Proximity |
Nature |
|
| Economy |
|
||
| Society |
|
||
|
|||
| Code |
Indicator |
Compass |
Linkages |
| N1 |
Marine
Environment Water Temperature |
Wellbeing |
|
| Economy |
|
||
| Society |
|
||
| N2 |
Number
of Species - Biodiversity |
Wellbeing |
|
| Economy |
|
||
| Society |
|
||
| N3 |
Percentage
Parkland (Open Space) |
Wellbeing |
|
| Economy |
|
||
| Society |
|
||
| N4 |
Percentage
Natural Environment |
Wellbeing |
|
| Economy |
|
||
| Society |
|
||
N5 |
Per Capita
Usage of Water |
Wellbeing |
|
| Economy |
|
||
| Society |
|
||
| N6 |
Particulates
in the Atmosphere (Air) |
Wellbeing |
|
| Economy |
|
||
| Society |
|
||
| N7 |
Kilowatt
Hours per Population (Energy) |
Wellbeing |
|
| Economy |
|
||
| Society |
|
||
| N8 |
Waste
to Landfill Kilograms per Capita |
Wellbeing |
|
| Economy |
|
||
| Society |
|
||
| N9 |
Number
of People Taking Action |
Wellbeing |
|
| Economy |
|
||
| Society |
|
||
| Contents: |
| Next: >> 5. Systems Mapping and Analysis Level << |
 |